
Pydeck, Python data visualization. Column Layer on Carto maps.
I will be exploring deck.gl geo data visualisation capabilities with Python and pandas library. Deck.gl is a WebGL-powered visualization framework for large-scale datasets, and pydeck is a high-scale spatial rendering for Python (powered by deck.gl).
Want to read it on Medium? Click here
LET'S GET STARTED
For this project, I am using Jupyter Notebook — the original web application for creating and sharing computational documents. It offers a simple, streamlined, document-centric experience.
The key Python library for this project is pydeck. By default, pydeck 0.6 provides basemap tiles through Carto. You can optionally use Mapbox API key, by registering for Mapbox. But, the Carto map is enough for this project.
Let's import pydeck via pip:
pip install pydeck
I prepared the data set of random store sales in 2020 across Estonia (a totally randomized dataset).
- We start by importing essential Python libraries for our operations: pandas, pydeck, os and optionally matplotlib.pyplot (I may develop this post in future)
  import pandas as pd
  import pydeck as pdk
  from pydeck.types import String
  import matplotlib.pyplot as plt
  import os
- Let’s list the files in the current directory and check if our .xlsx data source is stored here. We then import .xlsx data to Pandas Dataframe and set the index to store location name (in our case, numeric id).
  os.listdir() ## checking the current file composition of the folder
  df = pd.read_excel('stores.xlsx') ## reading .xlsx file to Pandas DataFrame
  df.set_index('Location Name') ## setting indexing to store's name
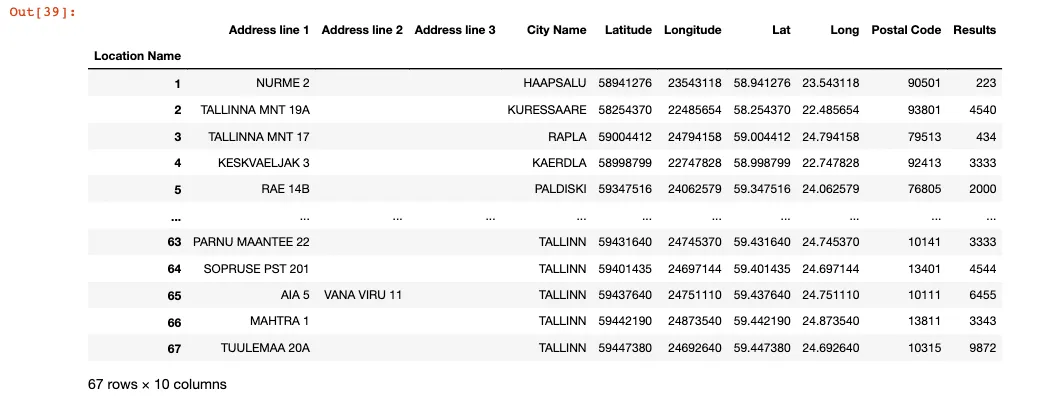
- We check the current columns of pandas DataFrame
  df.columns
  # output
  # Index(['Location Name', 'Address line 1', 'Address line 2', 'Address line 3',
  #    'City Name', 'Latitude', 'Longitude', 'Lat', 'Long', 'Postal Code',
  #      'Results'],
  #     dtype='object')
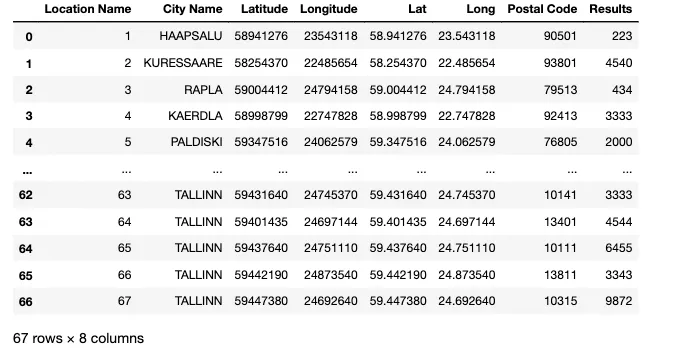
- and create new dataFrame df2 extracting the info we may need.
  df2 = df[['Location Name', 'City Name', 'Latitude', 'Longitude', 'Lat', 'Long', 'Postal Code', 'Results']]
  df2
- New df2 DataFrame would look like this:
- We ensure that longitude and latitude are of the ‘float’ type readable by pydeck class.
  df2["Long"] = df2["Long"].astype(float)
  df2["Lat"] = df2["Lat"].astype(float)
  df2
- We create the instance of Deck class with the selection of ColumnLayer and subsequent parameters.
  layer = pdk.Layer(
    'ColumnLayer',
    df2,
    get_position=['Long', 'Lat'],
    get_elevation=["Results"],
    auto_highlight=True,
    elevation_scale=5,
    pickable=True,
    extruded=True,
    get_radius=100,
    get_fill_color=["Results * 10", "Results", "Results * 40", 220],
    coverage=1
  )
- We set the initial viewport location on the geo area where we plot our data.
  # Set the viewport location
  view_state = pdk.ViewState(
    longitude=25.336900,
    latitude=54.734235,
    zoom=2,
    min_zoom=5,
    max_zoom=15,
    pitch=40.5,
    bearing=-27.36)
- Then we store all respective parameters in the variable, and pydeck allows us to create ultra light HTML (in this case, based on CARTO MAP) with the ColumnLayer plot of our store results.
  r = pdk.Deck(layers=[layer], initial_view_state=view_state)
  r.to_html('stores.html')
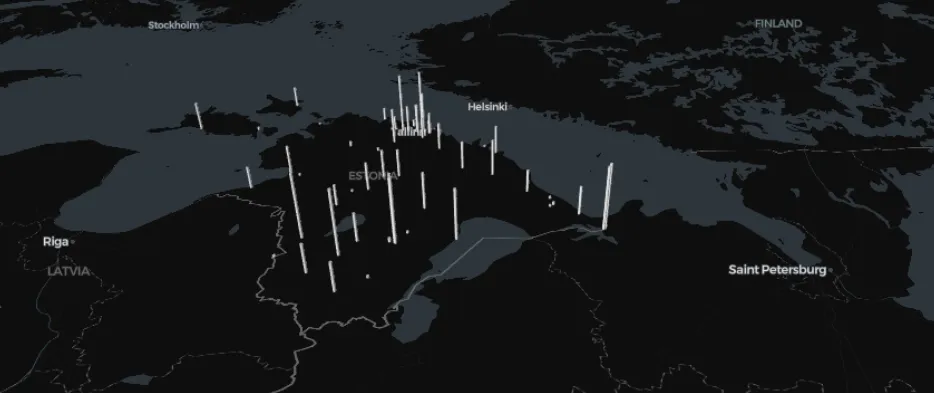
Great! I think this was a nice and quick walk through how to use pydeck, Carto maps and Pandas library to prepare the dataset to plot on the map. I hope you enjoyed it.